The Lock-in+PID application for Red Pitaya is organized in “instruments”, compiled all together in an common toolbox. It follows the same structure of the Free Software Red Pitaya original applications, described below. Each instrument has its own space in the web interface, separated in panels that can be folded/unfolded.
The instruments
The instruments themselves are:
- Two channel Oscilloscope (based on relese-0.95 scope application)
- Inputs and output control: A set of (de)multplexers to choose the signals flow through instrumentes, from input (ADC) channels to output (DAC) channels.
- Two Lock-in Amplifiers:
- An “Slow Harmonic Lock-in” that uses harmonic functions in quadrature for signal demodulation. The local oscillator goes from 3 Hz to 49 kHz.
- A “Fast square Lock-in” that uses square functions in quadrature for signal demodulation. The local oscillator goes from 30 mHz to 31 MHz.
- Square and harmonic oscillators: This instrument is part of each lock-in amplifier, but can be used for other applications.
- Ramp generator: produces triangle wave functions for scanning purposes.
- Two PIDs filters: Based on (based on relese-0.95 scope application), modified to achieve several orders of magnitude in the configuration parameters ranges. Proportional factor goes from 0.001 to 8000 and integral characteristic time goes from 8 ns to 9 sec.
- Auto-lock control: This tool lets you turn on/off the Ramp and PIDs instruments automatically to start an stabilization feedback loop on configurable events.
“Where” are the instruments?
The instruments are not really a “isolated portions of code” that works in an independent way. They are a logical division that lets you think in the configuration of the application as you would think of in a lab scheme. The combination of several instruments lets you control an experiment setup and measure the desired variables.
The core of the instruments is in the FPGA layer. Each of them are implemented as wired logical gates whose behavior is controlled by configurable FPGA registers (memory sectors that can be set up from the microprocessor / operating system). So, when you set the values of these registers you change the frequency of the lock-in local oscillator, choose the signal that goes to output 1 or modify the integrator characteristic time of one of the PID filters.
There are two ways to control theses registers. The direct way is executing code in the RedPitaya operating system that reads and writes directly in this registers. The other way is by using the Web Frontend, the RedPitaya App itself.
In this part of the documentation we cover the Web Frontend control. The Web App is an HTML+JS application that runs on your desktop/mobile browser and communicates constantly to a web server that runs on RedPitaya operative system. Each instrument has its controls and information grouped by panels in the web interface, for visual simplicity. When you use the these controls the web page sends the information the the web server, that process the information and change the values of the FPGA registers.
The layer structure
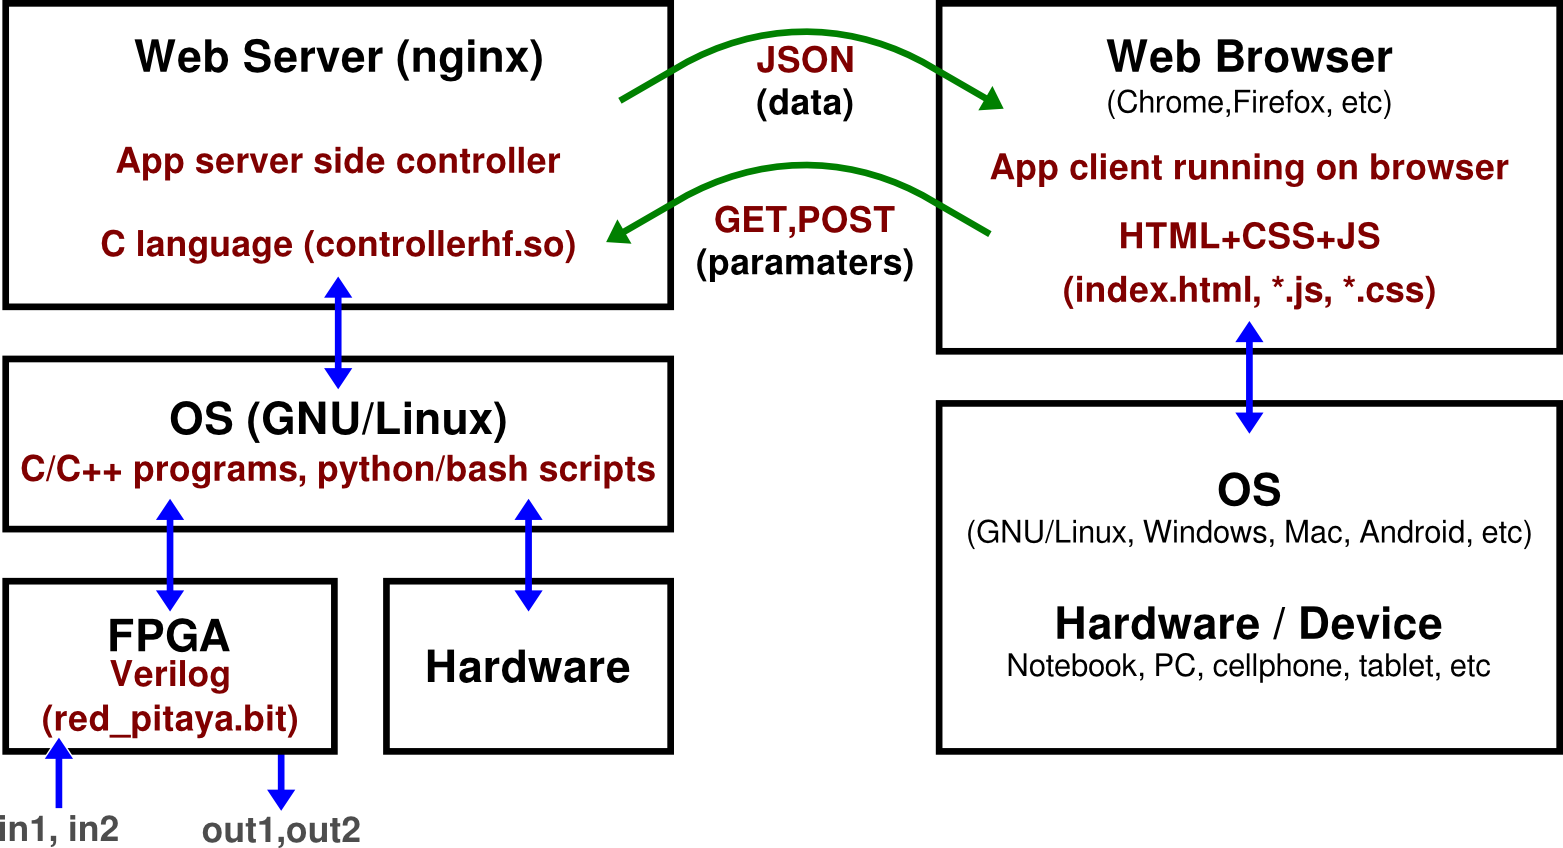
The Red Pitaya applications use a Client - Server structure that allows portability. The client is any device that supports an HTML5 web browser. It can be a Personal Computer, Notebook, Cell-phone, Tablet or even embebed devices. The client is the User Interface. The server is the Red Pitaya device, that processes the user commands and make the measurements.

More about client-Server structure
Client: a web page for user interface
The client gets a web page from a web server running in the Red Pitaya operating system. This web page is the interface for human interaction. It’s responsible for reading data from server, showing data plots, reading user actions on controls and send the HTML parameters associated with these actions to te server.
The web page is loaded in the browser. The display and control are designed in HTML5 language, and stylized with CSS style sheets. After loading, It runs JavaScript (JS) code that updates data and HTML parameters periodically (communicates with the server every 50 ms). The web page queries oscilloscope data and sends HTML parameters through GET and POST HTTP requests. After a while it receives from the server the data formated as JSON structure.
Server and hardware connection
A nginx Web Server runs on top of a
GNU/Linux Operative System.
The web server has some non-standard configurations made in LUA language to make the
Red Pitaya application environment. Each application has a controllerhf.so file
that is a library programed in C
and contains all the logic to process the HTML
parameters sent by the web page (that had come from user commands/actions).
Each time a request from the web page comes, it is processed by routines stored in controllerhf.so.
Theses routines takes actions on data formating and on FPGA circuit. After that, it reads
the oscilloscope data from FPGA, formats the data and send it as JSON structure to the web page again.
The controllerhf.so takes some of the HTML parameters and “translates” them to FPGA parameters:
a set of values stored in a reserved range of memory addresses that is linked to FPGA registers.
The operative system controls these memory ranges and is the nexus between the web server layer and the
FPGA layer.
The FPGA layer has the electronic circuit it self. Is the responsible for real-time processing of
hardware inputs and outputs. The circuit design is programed in
Verilog, it’s stored in red_pitaya.bit file of the
application and is loaded in the FPGA layer when you start up the application.
The circuit design cannot be changed on run time. However, the design is mad versatile through
control switches, multiplexers, de-multiplexers and logic elements that are controlled on run time
by the FPGA registers.
The web Frontend
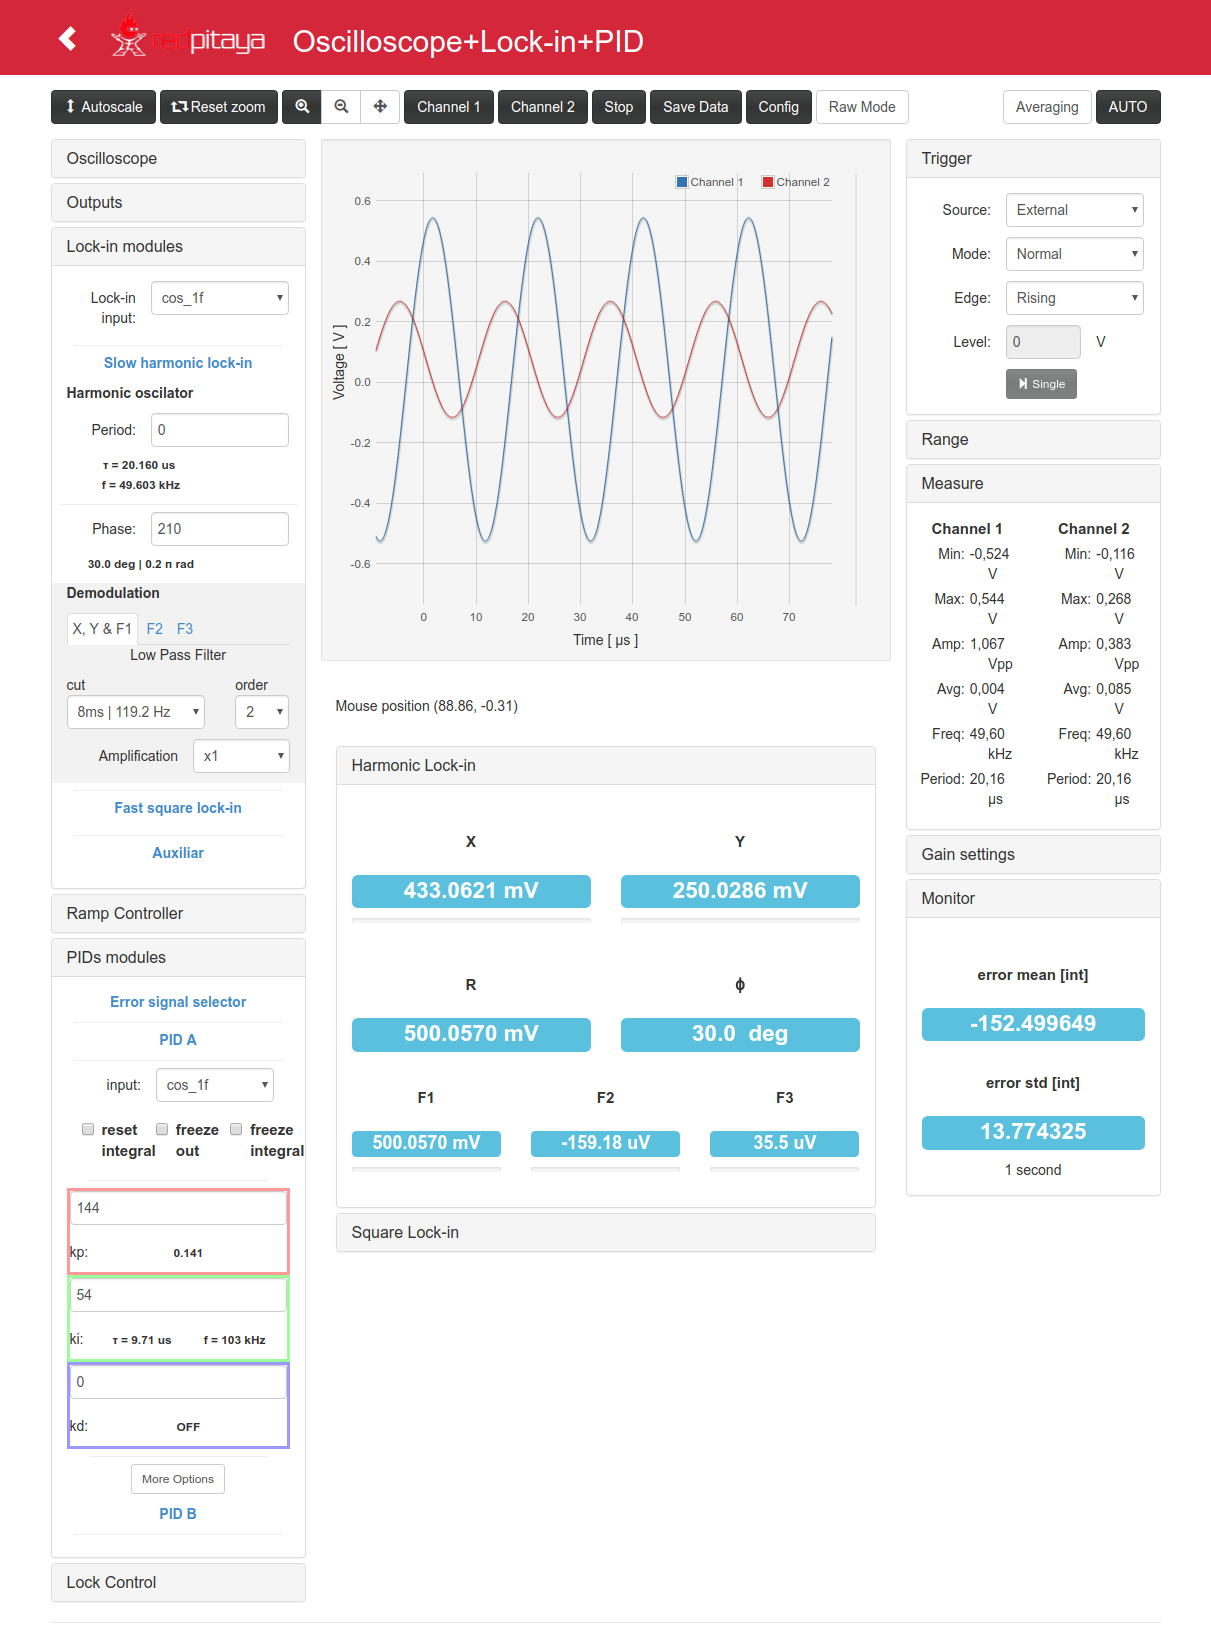
The web browser of the device you use to connect to the Red Pitaya shows you the user interface to control the device and watch the oscilloscope and other measurements.

Here you can see and example of how is seen this interface in a PC Firefox browser. In the center of the screen you can see the plot for both oscilloscope channels. Some buttons, number inputs and combo boxes lets you control the behavior of the instruments, that are grouped by panels. There are also some number displays for single-number data, used for example to display steady state of X and Y output of lock-in amplifier.